
Download D3.js Visualization Tool – Data Visualization Templates, Chart Maker, Interactive Charts
Overview
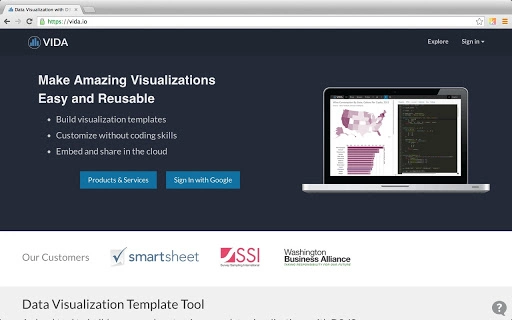
The D3.js Visualization Tool is a desktop application designed to streamline the creation and reuse of interactive data visualizations. Built for developers, data analysts, and designers, it enables users to define reusable templates using configurable settings, making it easier to maintain consistency across multiple visualizations. By cloning a template and applying new datasets, users can rapidly generate updated charts without rebuilding from scratch.
The tool supports a wide range of chart types, including line charts, bar charts, area charts, scatter plots, bubble charts, and geography maps, offering flexibility for diverse data storytelling needs. It also integrates with Google Charts, allowing users to create Google Visualizations through a drag-and-drop interface. The inclusion of a JSON editor provides granular control over chart properties, enabling advanced customization.
This tool is particularly useful in environments where rapid prototyping, dashboard development, or data exploration is required. The developer, DataViz Labs, has focused on usability and configurability, targeting professionals who need to deliver dynamic visualizations efficiently.
Key Features & Capabilities
- Template-Based Visualization Creation – Users can define reusable templates with pre-set configurations, allowing consistent visualization across projects. This reduces redundancy and speeds up workflow when multiple charts share similar styling or behavior.
- Drag-and-Drop Chart Builder – A user-friendly interface enables users to build Google Charts quickly by dragging visualization components onto a canvas, ideal for users with minimal coding experience.
- JSON Editor Integration – Advanced users can access and modify chart options directly through a built-in JSON editor, providing precise control over visual properties and behavior.
- Multi-Chart Type Support – The tool supports various chart types, including line, bar, horizontal bar, area, scatter, bubble, and geography maps, enabling comprehensive data representation.
- Dynamic Data Application – After cloning a template, users can apply new datasets and update properties to generate fresh visualizations in seconds, enhancing iteration speed.
User Interface, Workflow & Performance
The application features a clean, intuitive interface structured around a central canvas and a property panel. Users can navigate between templates, data inputs, and visualization previews with minimal friction. The drag-and-drop functionality is responsive, allowing quick assembly of chart components.
Workflow efficiency is enhanced by the template cloning system, which minimizes repetitive setup tasks. The application’s performance is expected to remain stable during typical usage, though specific resource consumption details were not provided. The developer did not specify CPU or RAM behavior under load.
General software behavior patterns suggest efficient handling of moderate-sized datasets, but performance may vary based on data complexity and chart type. Stability during prolonged use was not documented. The interface remains consistent across sessions, and no known issues with rendering or responsiveness were reported.
Users can expect a smooth experience when working with standard visualization tasks, particularly those involving predefined templates and straightforward data inputs.
Compatibility & System Requirements
The D3.js Visualization Tool is compatible with both Windows and Mac operating systems. It is available in version 1.2.0 and has a download size of 24.5 MB. The application is designed for desktop use and does not require a web browser or external dependencies for core functionality.
Exact system requirements were not listed, including minimum CPU, RAM, or storage specifications. Platform compatibility information is limited to the supported operating systems. No mention was made of specific hardware requirements or compatibility with older OS versions.
Users should ensure their system meets general desktop application standards. The developer did not provide additional system requirements beyond the OS support.
Pros and Cons
Pros
- Efficient template reuse reduces time spent on repetitive chart setup.
- Drag-and-drop interface lowers the barrier for non-technical users.
- Support for multiple chart types increases versatility.
- JSON editor allows advanced customization for experienced developers.
- Fast data application and property updates streamline workflow.
Cons
- Exact system requirements were not specified, limiting compatibility assessment.
- No information on performance with large or complex datasets.
- Limited details on update frequency or future development roadmap.
- Offline functionality not confirmed beyond standard desktop use.
- Compatibility with third-party tools or export formats was not described.
FAQ Section
Is the D3.js Visualization Tool available for Windows and Mac?
Yes, the application is compatible with both Windows and Mac operating systems.
Can I use this tool without coding knowledge?
Yes, the drag-and-drop interface allows users with minimal technical experience to create charts quickly. Advanced options like the JSON editor are available for those who wish to customize further.
Does the tool support exporting visualizations?
The product description does not specify export formats or functionality. Users should refer to the official documentation or in-app features for details.
Is the software free to use?
Yes, the D3.js Visualization Tool is available at no cost.
How often are updates released?
Specific update frequency was not provided. The current version is 1.2.0, released on October 15, 2023.
Final Thoughts + CTA
The D3.js Visualization Tool offers a practical solution for teams and individuals focused on creating consistent, interactive data visualizations. Its template-driven approach, combined with a user-friendly drag-and-drop interface and powerful JSON editing, makes it suitable for both beginners and experienced developers. The ability to rapidly generate charts from existing templates enhances productivity, especially in data dashboard and reporting workflows.
While some technical details such as system requirements and performance under load remain unspecified, the tool’s core functionality is well-aligned with modern data visualization needs. For data analysts, developers, and designers seeking a reliable, free desktop application to build and manage interactive charts, this tool presents a compelling option. Download D3.js Visualization Tool now.